Photo courtesy of Washington University.
“Cutting edge technology is taking us farther and faster into an extraordinarily challenging domain where the human brain is trying to understand the human brain,” declares Washington University’s Dr. David van Essen, lead investigator for the Human Connectome Project, a consortium of nine institutions.
The $30 million Human Connectome Project plans to create a wiring diagram for the human brain in the next five years. This massive undertaking, led by Washington University School of Medicine and the University of Minnesota’s Center for Magnetic Resonance Research, will make a road map showing how each small area of the cerebral cortex connects to the rest of the brain. The map will give detailed information down to a resolution of 1-2 cubic millimeters.
The brain contains about 90 billion nerve cells (neurons) that make approximately 150 trillion synapses (connections) with each other. Trying to untangle such a vast network seems dazzling in its audacity. However, the Human Genome Project seemed like an impossible dream at one point.
The imaging technologies that will be used to draw the map are non-invasive and safe, allowing investigators to explore both function and structure in the living normal brain. Benefits will surely follow. With the map in hand, neuroscientists in the future will be able to see how the brain structure of patients with diseases like Alzheimer’s, Parkinson’s, and autism differs from normal brain structure.
For example, explains Saint Louis University neurosurgeon Richard Bucholz, deep brain stimulation with an electrode surgically implanted into certain regions can relieve many of the symptoms of Parkinson’s. But the treatment often has serious side effects. A detailed map should allow the surgeon to pinpoint the areas where stimulation will help, and avoid the areas where stimulation will cause undesirable side effects.

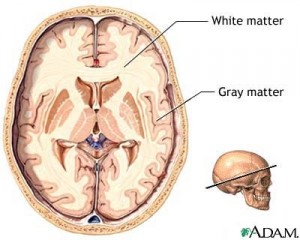
This study is not simply updated textbook anatomy. One of the new imaging techniques will indeed generate a high resolution representation of the physical wiring that traverses the brain as white matter. (White matter consists of bundles of axons—the long processes that carry impulses from the cell body to synapses with other cells. These processes are protected with a sheath that is white in color. Grey matter consists mostly of nerve cell bodies. The cerebral cortex that lies under the skull is grey matter.)
In addition, the Connectome will map functional connections. Whether at rest or while performing mental tasks, discrete areas across the brain fire off impulses that are synchronized in time and pattern. These synchronized areas are said to have functional connectivity.
The Connectome will study the brains of twins and their siblings
Twelve hundred subjects will participate in the Connectome project: 150 pairs of identical twins, 150 pairs of fraternal twins, and 600 siblings of those twins. All will be healthy young adults with no known neurological problems.
This distribution should shed light on the influence of environment vs. genetics in individual brain wiring. Van Essen points out that environmental influence begins in the womb. Even identical twins have unique wrinkling patterns on the surface of the brain, almost as different from each other as from strangers.
Washington University will scan each subject’s brain in a number of different ways to give a complete picture of both structural and functional connections. The data from all the scans will be processed by the University’s supercomputer. Some subjects will also go to Saint Louis University for another type of imaging, and some will travel to the University of Minnesota, where a more powerful scanner can generate images with finer detail.
Between imaging sessions, the subjects will be given a battery of tests including IQ, personality profile, and a short neurological work-up.
Ever-evolving advances in imaging technology enable neuroscientists to ‘see’ nerves at work.
The main imaging tool will be magnetic resonance imaging (MRI.) Many of us have undergone MRI scans that produce a three dimensional image of soft tissue anatomy. This type of MRI will be just one of the scans done on the Connectome subjects. The MR scanner is versatile, and changing its settings allows its computer to generate images based on properties of various molecules.
At Washington University, MRI scans will show the brain’s basic anatomy. Different settings will create images of functional brain connections both at rest and during the execution of intellectual and motor tasks. The same scanner set differently will map the bundles of nerve axons(white matter) that connect the gray matter areas of the brain.
Meanwhile, at Saint Louis University, a very different imaging technique called MEG (Magnetoencephalography) will detect neuronal responses in approximately real time.
How can a scientist ‘see’ that neurons are active in a given area of the brain? The principal at work in functional MRI is that a neuron uses energy to fire an electrical impulse. Blood flow increases to the active area to restore oxygen and glucose (fuel), in a response about 20 seconds long. The MRI scanner can be set to distinguish between oxygenated and de-oxygenated blood, and successive scans can detect how blood oxygen levels at any point change with time.
The assumption in functional MRI imaging is that regions of the brain showing simultaneous fluctuations in blood oxygen levels are connected to each other through one or more synapses.

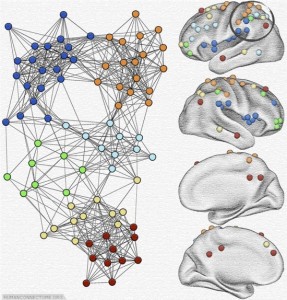
On the left, the number of lines between dots diagramatically represents the strength of connections between them.
An article highlighted on the Human Connectome Project website shows how maps of functional connections are made. The work was the doctoral thesis of Steven Nelson in the laboratory of Steven Petersen at Washington University. Nelson was interested an area of the brain linked to attention and memory retrieval, the left lateral parietal cortex.
To construct the map of relationships shown in the figure, Nelson and Petersen investigated functional MRI connections in both resting brains and in brains engaged in a specific task. In these experiments, the subjects were asked to focus on a crosshair during the scan.
The basic map of parietal cortex connections came from resting state functional MRI data. Pioneering work by Marcus Raichle of Washington University and others has shown that very slow frequency activity patterns displayed by the resting brain are not, as assumed previously, just noise. These activity patterns are actually responsible for most of the brain’s energy use, and can be seen in sleep and even in a coma state. And Raichle’s work has shown that areas with simultaneous slow fluctuations in blood oxygen levels are truly connected.
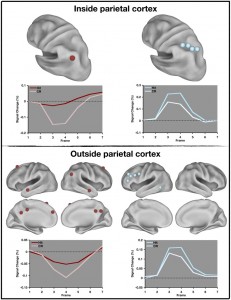
Nelson and colleagues performed resting functional MRI on 28 healthy subjects. After extensive preliminary analysis, they selected 15 small areas in the left parietal cortex, circled in the figure, to be mapped in detail. Some of them showed strong functional connections to each other (note the orange dots) as well as to other areas (more orange dots) across the brain. The red dot, on the other hand, was strongly related to a number of brain regions, but none close by.
The subjects were asked to perform a memory retrieval task. First they were shown a series of pictures. Then, while being scanned, they were shown a series of pictures containing some of the originals, and some new pictures. They indicated whether or not they had seen the picture in the first series. In this case, the responses as shown by local changes in blood oxygen levels peaked at 6-8 seconds, and differed in pattern depending upon whether the picture was “old” information or new.

The results confirmed the original mapping of the resting brain. The same areas that had shown functional connections at rest responded together. Moreover, in many cases, the response patterns at the remote sites were very similar to the response pattern in the parietal, as shown in the figure.
Functional imaging in real time
The functional MRI responses occur after the neuron fires and the time scale is seconds to minutes. A different kind of imaging called MEG (Magnetoencephalography) can show regions of active nerve cells in real time. MEG takes advantage of the fact that every time an electrical signal varies, it sends out a parallel magnetic wave that can be picked up by magnetic detection devices called magnetometers .
Richard Bucholz of Saint Louis University uses MEG to detect the time sequence of neuronal firing when a subject does a task such as moving a finger. The subject sits in a device that looks like a hair dryer, but that is really a helmet of about 300 magnetometers. A computer synthesizes the signals to place the source of the magnetic wave in three-dimensional space. By superimposing the 3-D magnetic source on an anatomical MRI scan of the individual subject’s brain, he can see where in the brain the finger movement comes from.
Furthermore, because MEG measures changes on a time scale of thousandths of a second, it may be possible to detect the sequence in which functionally connected neurons fire.
Images of structural connections come from MRI also
To map the actual physical wiring that connects areas of the gray matter, neuroscientists call again upon the MRI scanner.

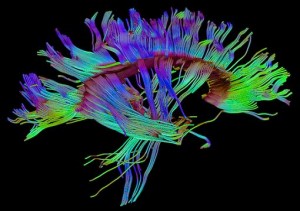
Photo courtesy of Cedars-Sinai Medical Center
DTI (diffusion tensor imaging) is based on the fact that water molecules bounce around in a random fashion called diffusion. However, in a long and very thin tube, water molecules diffuse more freely down the length of the tube than across it. Axons– the long processes that carry the nerve’s electrical impulse away from the cell body to synapses with other cells—are structurally long thin tubes. In DTI, certain water molecules are “tagged” with magnetic pulse sequences and followed as they lose their tag. DTI shows the 3-D placement of axon bundles in the white matter.
Radiologist Josh Shimony points out DTI imaging is advancing so quickly that data from even 5 years ago is out of date.
The supercomputer will integrate and analyze the data
The acquisition of data from brain imaging and testing is just the beginning. As stated by Dan Marcus of Washington University, “Imaging data is a stack of 2-D pictures on the supercomputer, but integrating all into the connectivity information—how point A is connected to point B—will generate up to a petabyte of data.” A petabyte is 1 quadrillion bytes of information.
Connectome findings will be available to the scientific community
All the raw data and analysis from this NIH funded project will be made available to the entire scientific community. Marcus, who is in charge of the informatics, is working with partners at the 8 other institutions of the consortium to develop analysis and imaging methods.
The van Essen lab is developing a downloadable desktop application for visualizing the data and navigating through it, called the Connectome Workbench. Marcus’s lab is developing the database that will feed into the Workbench.
Marcus compares the computational side to Google Earth. They are building an atlas of connections in the human brain, that people will be able to explore visually. A scientist can go into the human brain atlas, click on a point, and see what is connected to both functionally and physically. The click will bring them into the database on the supercomputer at Washington University for answers.
This database is more complicated than Google Earth, because there is only one earth, but data from 1200 brains will be in this system at the beginning. They will try to synthesize these 1200 brains into one representative “normal brain” reference.
At the same time they want to understand the variability among brains. An investigator may want to compare high IQ to low IQ brains, or optimists to pessimists. Because each individual brain, its cognitive profile, and its analysis will be on the database, comparisons should be meaningful and accurate.
The project will have a strong outreach program to help train investigators learn how to capitalize on the Connectome data. They will provide tutorials, seminars, and webinars.
Lots of questions will be answered as this project progresses, and likely more will be raised. One of the major questions is just how much agreement will be found between structural connectivity and functional connectivity. Studies to date have shown a great deal of overlap in many areas, but less in other areas. However, as Shimony point out about a study he participated in, many of the differences can be explained by limitations in the methods.
Finally, the 1 cubic mm ‘voxels’ that will be the building blocks of the map can contain up to a million neurons. It is certainly possible that this level of detail will not be able to answer all questions. Maybe, for example, personality traits are defined by smaller groups of cells. But in five years time, it is also certainly possible that more powerful imaging techniques will be applicable to the involved areas pointed out by the Connectome project.
This article was originally published in the St. Louis Beacon.
